Hey Community
We have been trying to get to the bottom of why we get random MySQL and MariaDB stops/restarts across the Enhance servers since upgrading to v12 and this is the closest we have come to getting a detailed output.
To try and figure this out we setup 1 script that runs every 15 seconds and logs the "ps -aux" output to a daily log file.
We also have another script that runs every minute and logs the output from top and vmstat to another daily log file.
Finally we setup the following audit rules on all servers which should catch any process calling the kill or systemctl command.
-w /usr/bin/systemctl -p x -k systemctl_exec
-w /bin/systemctl -p x -k systemctl_exec
-w /usr/sbin/service -p x -k systemctl_exec
-w /bin/kill -p x -k kill_mysql
-w /usr/bin/kill -p x -k kill_mysql
-w /usr/bin/pkill -p x -k kill_mysql
-w /usr/bin/killall -p x -k kill_mysql
The 15 second script was setup to catch the name of the process that the audit log would display as it does not give you the name of the process, only the process id if it catches it.
For context, this is the MySQL configuration which is basically the default with a few minor tweaks
[mysqld]
skip-log-bin
#ssl-ca=/etc/certs/mysql/ca.pem
#ssl-cert=/etc/mysql/ssl/cert.pem
#ssl-key=/etc/mysql/ssl/key.pem
skip-name-resolve
collation-server = utf8_unicode_ci
character-set-server = utf8
log_error_suppression_list='MY-013360'
default_authentication_plugin = mysql_native_password
skip-host-cache
innodb_buffer_pool_size=512M
log_error=/var/log/mysql/error.log
max_user_connections=25
tmp_table_size = 64M
max_heap_table_size = 64M
max_allowed_packet = 128M
wait_timeout = 300
interactive_timeout = 300
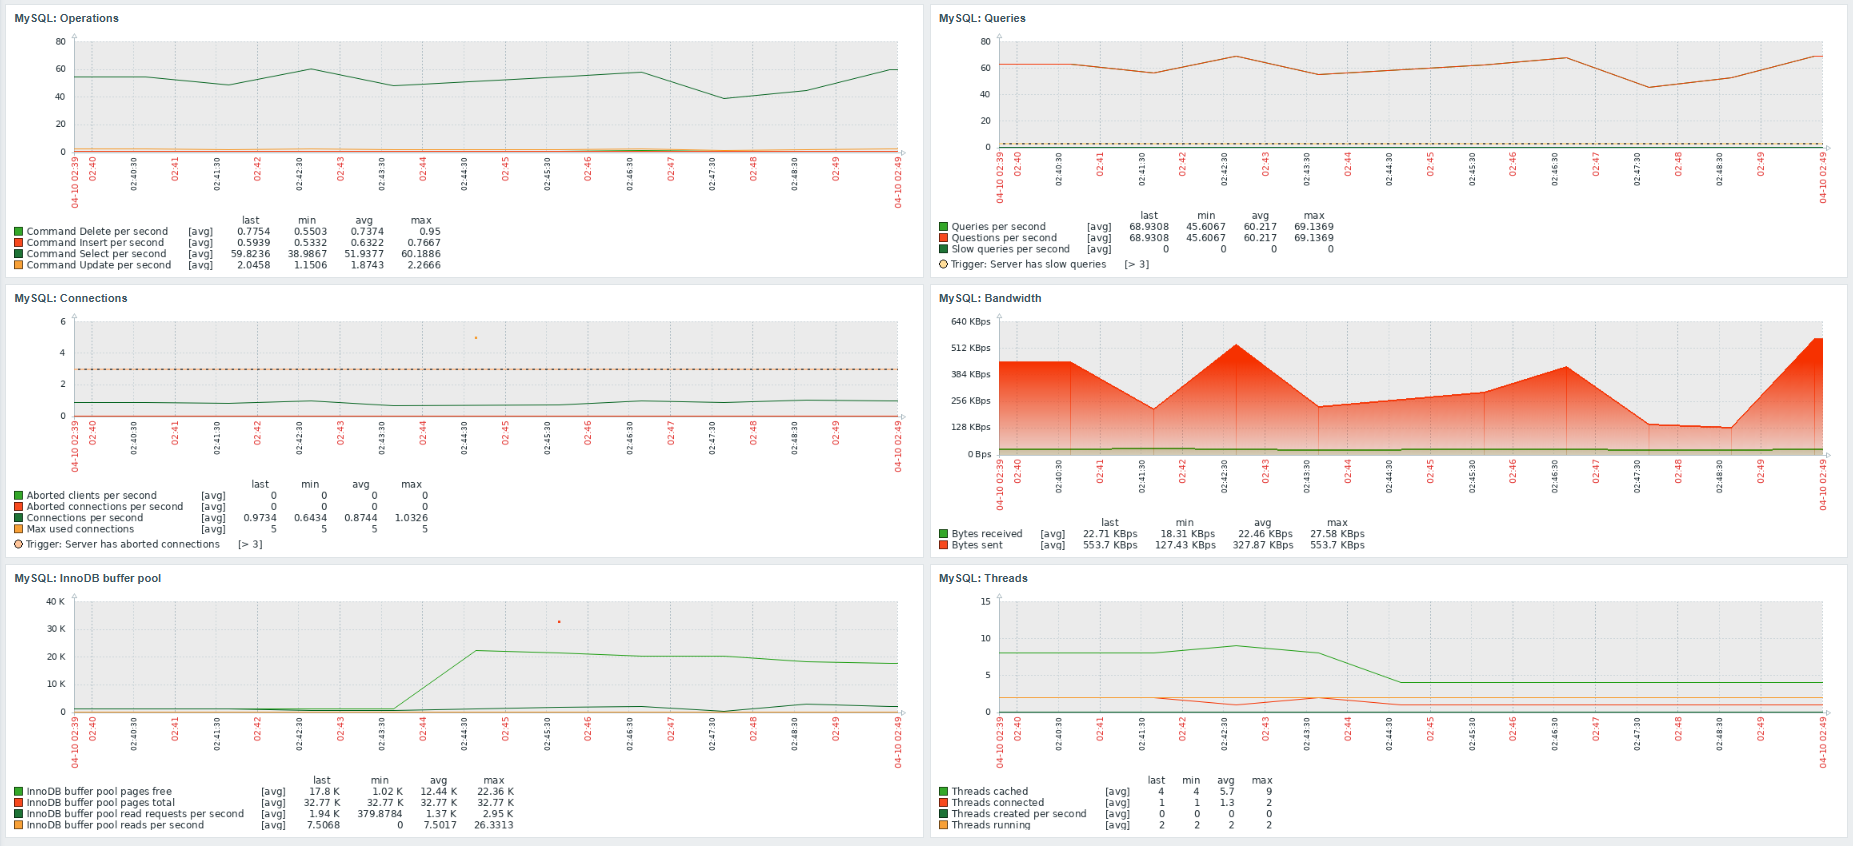
So, this morning at 02:43:49 one of the servers had MySQL killed using the kill -9 signal, we know it was killed because we can see this in the syslog
2025-04-10T02:43:49.438505+01:00 vps529 systemd[1]: mysql.service: Main process exited, code=killed, status=9/KILL
2025-04-10T02:43:49.438902+01:00 vps529 systemd[1]: mysql.service: Failed with result 'signal'.
2025-04-10T02:43:49.439250+01:00 vps529 systemd[1]: mysql.service: Consumed 2h 28min 8.413s CPU time, 6.0G memory peak, 0B memory swap peak.
2025-04-10T02:43:49.602971+01:00 vps529 systemd[1]: mysql.service: Scheduled restart job, restart counter is at 1.
2025-04-10T02:43:49.611744+01:00 vps529 systemd[1]: Starting mysql.service - MySQL Community Server...
There are no other entries before these in syslog which relate to any problems with MySQL, only IPDB blocked rules.
And if we look at the mysql error log, we see this entry
2025-04-10T02:43:49.231935Z+01:00 0 [System] [MY-013172] [Server] Received SHUTDOWN from user <via user signal>. Shutting down mysqld (Version: 8.0.41).
We searched the audit logs using "ausearch -k kill_mysql" and "ausearch -k systemctl_exec" but nothing was logged for this morning, we searched the "/var/log/kern.log*" files for the kill word but nothing in there either.
We can't search our journal logs because they only go back as far as 03:00 this morning, no idea why these keep disapearing but again this happens on all the backup servers and on the servers where there are more than around 10 websites.
So, even though it wasn't logged it potentially looks like an OOM Killed it but the server memory was fine as far we can see from these top snapshots just before and after the event can't we?
This particular server has 8 vcpus and 32 GiB memory and here is the output from top at 02:43:01 (just before MySQL was killed) and then at 02:44:01 (just after MySQL was killed) - MySQL was killed at 02:43:49.
top - 02:43:01 up 3 days, 23:34,  0 user,  load average: 0.71, 0.46, 0.51
Tasks: 379 total,   1 running, 378 sleeping,   0 stopped,   0 zombie
%Cpu(s):  6.0 us,  9.5 sy,  0.0 ni, 84.5 id,  0.0 wa,  0.0 hi,  0.0 si,  0.0 st
MiB Mem :  32040.5 total,   1058.5 free,  11942.6 used,  24687.4 buff/cache
MiB Swap:   4096.0 total,   4093.7 free,      2.3 used.  20097.9 avail Mem

    PID USER      PR  NI    VIRT    RES    SHR S  %CPU  %MEM     TIME+ COMMAND
2231089 root      20   0   38660  22256  14100 D  18.2   0.1   0:00.02 cpguard-job-logs::fetchlogs
2231058 root      20   0   12332   5652   3476 R   9.1   0.0   0:00.01 /usr/bin/top -cSb -n 1
      1 root      20   0   23868  14624   9256 S   0.0   0.0 241:17.06 /sbin/init
      2 root      20   0       0      0      0 S   0.0   0.0   0:00.10 [kthreadd]
      3 root      20   0       0      0      0 S   0.0   0.0   0:00.00 [pool_workqueue_release]
      4 root       0 -20       0      0      0 I   0.0   0.0   0:00.00 [kworker/R-rcu_gp]
      5 root       0 -20       0      0      0 I   0.0   0.0   0:00.00 [kworker/R-sync_wq]
      6 root       0 -20       0      0      0 I   0.0   0.0   0:00.00 [kworker/R-slub_flushwq]
      7 root       0 -20       0      0      0 I   0.0   0.0   0:00.00 [kworker/R-netns]
      9 root       0 -20       0      0      0 I   0.0   0.0   0:00.00 [kworker/0:0H-events_highpri]
     12 root       0 -20       0      0      0 I   0.0   0.0   0:00.00 [kworker/R-mm_percpu_wq]
     13 root      20   0       0      0      0 I   0.0   0.0   0:00.00 [rcu_tasks_rude_kthread]
     14 root      20   0       0      0      0 I   0.0   0.0   0:00.00 [rcu_tasks_trace_kthread]
!---------------------------------------- vmstat 1 4
procs -----------memory---------- ---swap-- -----io---- -system-- -------cpu-------
 r  b   swpd   free   buff  cache   si   so    bi    bo   in   cs us sy id wa st gu
 0  1   2352 1074876 1824968 23454972    0    0    95  1825 3276    5  3  1 95  1  0  0
 0  0   2352 1076172 1824968 23454936    0    0     0   416 1757 2263  0  0 99  1  0  0
 1  0   2352 1066336 1824968 23454932    0    0     0     8 2485 3553  3  1 96  0  0  0
 0  0   2352 1085316 1824968 23454964    0    0     0  1684 3055 4422  3  1 96  0  0  0

top - 02:44:01 up 3 days, 23:35,  0 user,  load average: 0.40, 0.42, 0.49
Tasks: 392 total,   4 running, 388 sleeping,   0 stopped,   0 zombie
%Cpu(s): 47.3 us, 20.9 sy,  0.0 ni, 31.9 id,  0.0 wa,  0.0 hi,  0.0 si,  0.0 st
MiB Mem :  32040.5 total,   2468.3 free,  10248.9 used,  24971.2 buff/cache
MiB Swap:   4096.0 total,   4093.7 free,      2.3 used.  21791.6 avail Mem

    PID USER      PR  NI    VIRT    RES    SHR S  %CPU  %MEM     TIME+ COMMAND
2231361 xxxxxxx+  20   0  185172  89096  30532 R 100.0   0.3   0:00.20 php /usr/bin/wp-cli cron event run --due-now --path=public_html
2231363 yyyyyyy+  20   0  181076  85384  30904 R 100.0   0.3   0:00.20 php /usr/bin/wp-cli cron event run --due-now --path=public_html
2231362 zzzzzzz+  20   0  154872  81152  30672 R  90.9   0.2   0:00.20 php /usr/bin/wp-cli cron event run --due-now --path=public_html --quiet
   3382 xxxxxxx+  20   0   65336  17272   9784 S   9.1   0.1   4:35.63 /usr/bin/redis-server 127.0.0.1:6379
2229969 root      20   0       0      0      0 D   9.1   0.0   0:00.05 [kworker/u32:0+events_unbound]
2231261 mysql     20   0 2950344 603808  38272 S   9.1   1.8   0:01.09 /usr/sbin/mysqld
2231393 root      20   0   38624  22224  14184 D   9.1   0.1   0:00.01 cpguard-job-logs::fetchlogs
      1 root      20   0   23836  14624   9256 S   0.0   0.0      6,29 /sbin/init
      2 root      20   0       0      0      0 S   0.0   0.0   0:00.10 [kthreadd]
      3 root      20   0       0      0      0 S   0.0   0.0   0:00.00 [pool_workqueue_release]
      4 root       0 -20       0      0      0 I   0.0   0.0   0:00.00 [kworker/R-rcu_gp]
      5 root       0 -20       0      0      0 I   0.0   0.0   0:00.00 [kworker/R-sync_wq]
      6 root       0 -20       0      0      0 I   0.0   0.0   0:00.00 [kworker/R-slub_flushwq]
!---------------------------------------- vmstat 1 4
procs -----------memory---------- ---swap-- -----io---- -system-- -------cpu-------
 r  b   swpd   free   buff  cache   si   so    bi    bo   in   cs us sy id wa st gu
 4  0   2352 2440068 1828244 23743340    0    0    97  1825 3276    5  3  1 95  1  0  0
 0  0   2352 2590880 1828248 23743784    0    0   500  1780 6258 5815 17  3 79  2  0  0
 0  0   2352 2563720 1828248 23743784    0    0     0    40 1676 2018  2  1 98  0  0  0
 0  0   2352 2563468 1828248 23743784    0    0     0     0 1202 1833  0  0 99  0  0  0
So, this server had plenty of free memory before MySQL was killed so what am I missing?
I have since this morning also added the following audit rule to try and catch low-level kill() syscalls
-a always,exit -F arch=b32 -S kill -F a1=9 -k kill_signal9
I am starting to suspect that something with the cgroups setup is causing the server to "think" it is out of memory when it isn't but how do I prove or disprove that?
Any thoughts or suggestions are welcome as we are scratching our heads here!